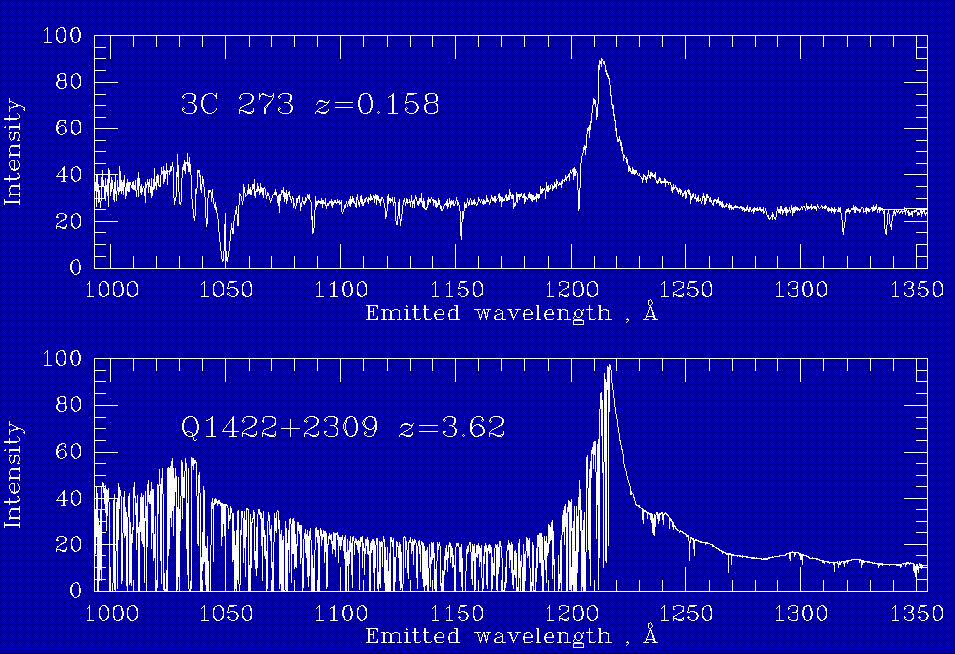
All quasars at high redshift exhibit huge numbers of narrow absorption lines starting at the wavelength of the quasar's own Lyman alpha emission line and extending blueward. These are Lyman alpha absorption from foreground structures, in which the quasar light probes an otherwise invisible component of cosmic gas. This component evolves strongly with cosmic time, since we see dramatically more absorbers (be they clouds, filaments, or even crowding in velocity rather than in space) toward higher redshifts. However, they have not completely disappeared. When the launch of HST provided the first capability of measuring Lyman alpha at low redshifts to the required accuracy, it was found that a few of these absorbers remain in the local Universe. They are generally but not specifically associated with galaxies - for instance, 3C 273 lies behind the Virgo cluster of galaxies, and has a couple of absorbers in the cluster's redshift range, but they cannot be cleanly identified in position and redshift with specific neighboring galaxies. The evolution of the Lyman-alpha forest may be intimately connected with the history of galaxy formation.
This panel compares two quasars at very different redshifts, 3C 273 at z=0.158 and 1422+2309 at z=3.62, shifted to a common scale in emitted wavelength. The strong and broad emission peak is Lyman alpha, which is almost chopped in half by the onset of the Lyman alpha forest in the high-redshift quasar. At low redshift, 3C 273 shows only a handful (but distinctly more than zero) Lyman alpha absorbers, including the strong and broad absorption from its light intercepting the disk of a foreground spiral galaxy (ours). Our galaxy also produces absorption in the C IV lines around 1550 A, which appear at 1337 A in the quasar's emitted frame. Hundreds of lines can be identified in the spectrum of 1422+2309, with the densest concentration near the quasar redshift - this is a very general feature showing how the density of Lyman alpha absorbers decreases with cosmic time. An increase appears again crossing 1026 A as the corresponding Lyman beta lines appear as well as new Lyman alpha lines.
The 3C 273 data are the average of two pre-refurbishment exposures totalling 49 minutes with HST's Faint-Object Spectrograph. The spectacular data for 1422+2309 come from 7-hour Keck I HIRES spectrum at resolution of 6.6 km/s, which comprised 94,000 spectral pixels in the original data provided by Mike Rauch. The data have been averaged down to more closely match the 3C 273 results, and make the graph a little more legible.