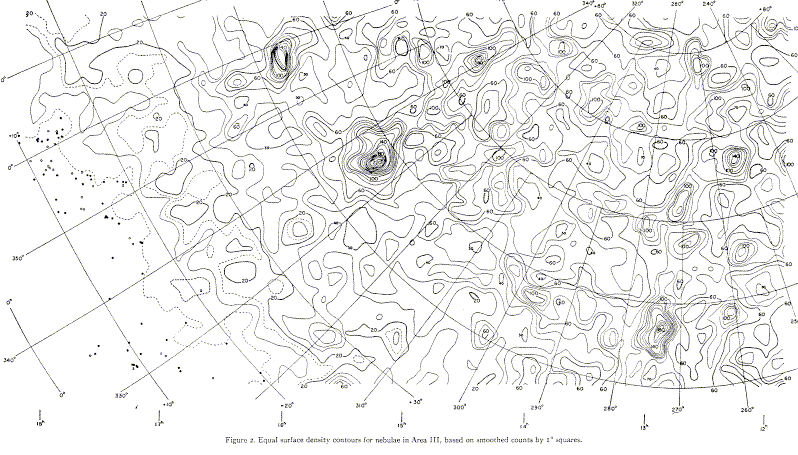
de Vaucouleurs long argued for the physical reality of a flattened distribution of nearby galaxies centered on the traditional Virgo cluster, extending well past our distance from the center - the Local or Virgo Supercluster, extent 50+ Mpc. Its reality now seems established on dynamical as well as density grounds. At larger distances, galaxy counts by themselves suggested that clusters sometimes group into superclusters or "clouds": as shown by Shane and Wirtanen (1954 AJ 59, 285, courtesy of the AAS),

These same data were reanalyzed by Seldner et al 1977 (AJ 82, 249) to produce the higher-resolution gray-scale map familiar from poster use (but which scanned so poorly for the ADS that most of the structure disappeared). The evidence for superclusters was reviewed by Oort 1983 (ARA&A 21, 373). One revealing way to see them is a set of sky maps sliced by redshift interval - see, for example, the ones in Fairall, Large-Scale Structures in the Universe (Wiley-Praxis 1997).
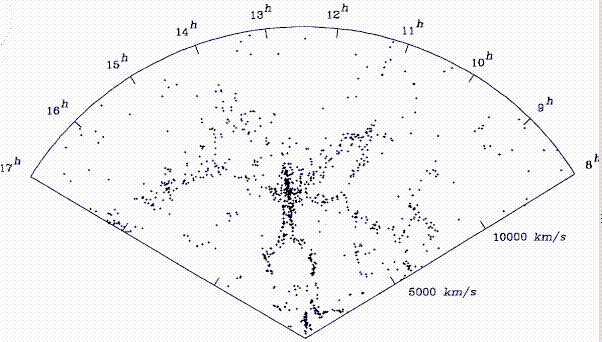
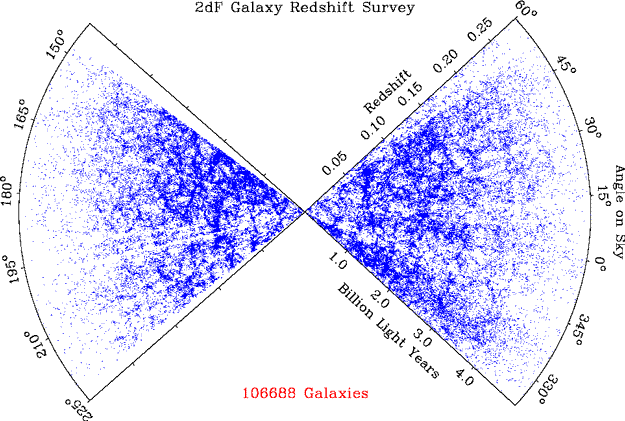
Clumps and groups of Abell clusters also exist, so that these have been used as tracers of the galaxy distribution to large distances - Abell 1961 (the year, not the cluster - AJ 66, 607), Murray et al 1978 (ApJLett 219, L89); Tully, Nearby Galaxies Atlas. These structures, if real, must persist in redshift as well as angular coordinates. Redshift surveys are now available for Abell clusters (since velocity dispersions require multiple objects anyway), for Zwicky galaxies and their southern counterparts from the CfA and SSRS groups; and for selected deep "postage-stamp" areas. The galaxy distribution is often shown in angle-redshift wedge diagrams. These frequently show intricate structure - clouds, superclusters, filaments, sheets, voids... as shown in the famous "Slice of the Universe" by de Lapparent et al 1986 (ApJLett 302, L1, courtesy AAS):
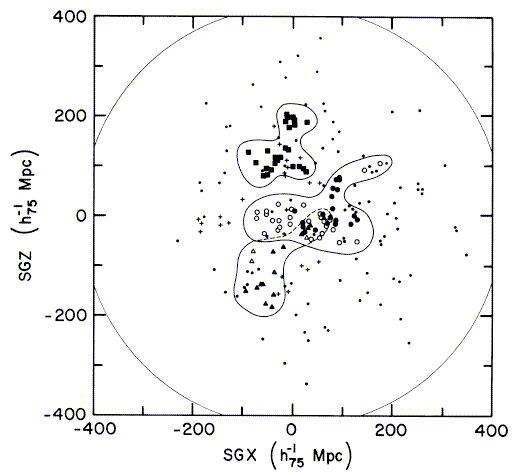
There is even evidence of structure extending on scales Δz=0.1 (Tully 1986 ApJ 303, 25 and Nearby Galaxies Atlas):
 and
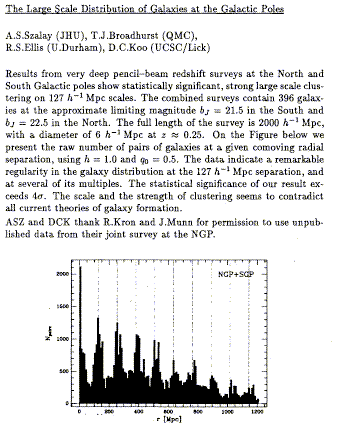
on equally large scales from the
following abstract (BAAS
1990, 22, 753). This caused a bit of a stir, provoking further surveys
in different directions to show that the apparent periodicity
was an artifact of looking through a few sheetlike structures and
not something about the redshifts per se.
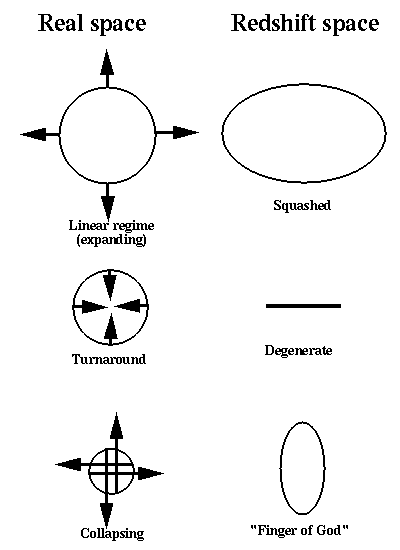
Giant structures, infall, and large-scale peculiar motions give new insight into how clusters form vis-a-vis galaxies. The two basic possibilities are bottom-up and top-down. Either galaxies form and then group into clusters, or protogalactic gas formed immense structures (such as Zeldovich disks) which only then fragmented into (proto)galaxies. Since we see that some clusters are still collecting galaxies, galaxies came first at least in many cases. Simulations of cluster dynamics agree with observations of substructure that many clusters have not yet reached dynamical equilibrium. There have been indications that clusters within superclusters are preferentially aligned, which if true would suggest dynamical processes that can leave a very long-lasting imprint. Following A. Hamilton's review in the volume The Evolving Universe (ed. D. Hamilton, Kluwer 1998), a cluster or other structure embedded in the Hubble expansion will have distinct signatures in a space-redshift slice depending on whether it is overall expanding (even if decelerating from the general expansion), just turning around from the expansion, or collapsing toward a relaxed structure. At early times, the cluster will appear "squashed" in redshift space, as cluster infall cancels some of the Hubble flow across the cluster. At turnaround, our ideal grouping approaches constant redshift as all the objects momentarily have zero radial velocity with respect to the core. As the cluster finally decouples from the Hubble flow, collapses, and eventually becomes dynamically relaxed, we get the familiar "finger-of-God" effect in which the internal velocities become very large, much larger than the differential Hubble flow across the cluster since the depth of the potential well is significant. Present-day structures exhibit this range, with galaxies surrounding rich clusters showing the squashing effect, much as seen in the complexities of the Hubble flow between here and the Virgo core, and rich clusters showing "fingers of God" in their inner regions. Linear transverse structures such as the "Great Wall" probably appear thinner than they really are due to this effect (at the 150 km/s or so level anywa; Dell'Antonio, Geller & Bothun 1996 AJ 112, 1780).
There have been claims (Keel et al. 1999 AJ 118, 2547, for one) that structures at high redshift are being seen at or before turnaround, based on the ratio of internal velocity dispersion to expected Hubble depth for reasonable geometries. Turnaround and collapse may well happen on different size scales at different times. This is a useful context to introduce comoving coordinates, a set of coordinates which follows the expansion of the cosmic scale factor so that processes due only to the Hubble expansion disappear. In this way, a cluster will show only collapse toward a relaxed state, since the initial expansion in physical space results purely from the Hubble flow.
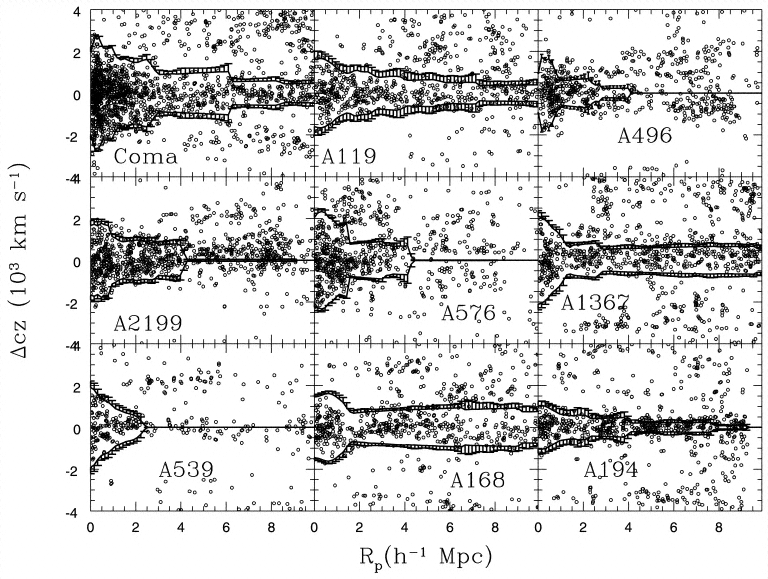
Various regions around a cluster may be in different states at the same time - in fact, usually are. Even local distance/redshift data show that there is a large region with systematic infall toward the Virgo cluster. As shown in the CAIRNS survey (one reference is Rines et al. 2003, AJ 126, 2152, from which the following picture is used courtesy of the AAS), rich clusters are generally surrounded by a dynamically distinct region of infall, complete with a turnaround radius visible in the angle-redshift slice of phase space. In one dimension, these regions can be detected (at least in principle) as S-shaped perturbations to the Hubble redshift-distance relation, where there are systemastic streaming motions in front of and behind rich clusters.
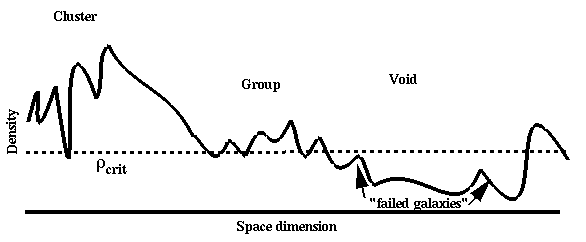
Along with large-scale clustering structure, redshift surveys have revealed its inverse - voids with dimensions 100 Mpc devoid of luminous galaxies. They also occur in the single dimension probed by QSO absorption lines using the Lyman α forest, so the deficit isn't only in fraction of gas converted to stars in galaxies (though there are complexities introduced by the ionization of intergalactic matter due to QSOs and starburst galaxies, and by confusion of spatial and velocity structure along a single available line of sight). Voids pose particular challenges to theories of galaxy formation. Why do they exist with relatively sharp edges, when dark matter presumably doesn't sustain such strong boundaries? A very general consideration is forming large scale structure is that material must move at a velocity of order R/tH to clear a void of radius R in a Hubble time, and if this process is all gravitational, the density contrast has to have been able to accelerate the material to this velocity. Starting with the uniformity shown by the microwave background, it is not all obvious that there was enough density structure to do this. One popular answer to this apparent mismatch of structures, as seen in galaxies and the plausible density field, is biased galaxy formation - the notion that collapse to a galaxy requires a certain threshold density, which is almost never reached by fluctuations in the valleys of larger-scale density dips. The following cartoon depicts a density slice through a complicated density field with power on a wide range of scales, and the idea of a bias threshold producing clusters, groups, and voids out of proportion to the local density. It is customary to define a biasing parameter b which relates fluctuations in the overall mass and light distributions. Thus, for a galaxy overdensity (defined statistically) δ and mass overdensity δM, we have δ = b δM , while the power spectra scale as b2. Since in a simple approximation, the growth rate of mass perturbations scales with the mass contribution to the cosmic density as Ω M0.6, one often encounters the combination (called the redshift distortion parameter) β=Ω M0.6b in studies trying to solve derived density fields and galaxy distributions for b. This has the interesting property that structure amplitudes in redshift space are enhanced by a factor (1+β) over those in linear coordinate space. Hamilton's review (reference above) is a nice compendium of the density-velocity field connection, showing that values of β from 0.5 to 1 are allowed by existing surveys. To confuse matters somewhat, some papers use a bias parameter that runs inversely to this convention. Analysis of the 2dF galaxy survey suggests that bias is not important on scales 5-30 Mpc (Verde et al. 2002 MNRAS 335, 432), with a fitted linear bias parameter of 1.04 ± 0.11 and quadratic term -0.05 ± 0.08. On these scales (at least), both angular and redshift clustering suggest that mass does trace light. Biasing may still matter for galaxy formation, if not so much for the current galaxy distribution. Physically, one might imagine biasing to arise either as a threshold effect operating on the density field which is the superposition of components with a wide range of spatial frequencies (k in P(k)), or on a column-density criterion if star formation can disrupt galaxy formation in lower-density regions when its energy input drives the gas to expand.
Nongravitational ways to explain voids have been explored, though biassing has driven them from favor (Ostriker and Cowie 1981 ApJL 243, L17).
The "soap-bubble" or foamlike geometry revealed by large-scale redshift surveys has given rise to mathematical treatments of the walls and voids. A particularly popular description has been Voronoi tesselation, a way of generating the minimum-area set of surfaces dividing a given set of generating points (i.e. void centers). This division in two dimensions gives the set of line segments with minimum total length that separates the generating points into their own regions bounded by polygonal tesselations, with the obvious generalization to three dimensions. In two dimensions, the Voronoi tile around a given generating point is the smallest polygon produced by lines bisecting the radius vector between the generating point and all other tile generators, which is to say the boundary containing points closer to the generating point than to any other in the set. For those interested, IDL has a routine to compute the Voronoi tesselation of 2D coordinate lists.
Last changes: 9/2009 © 2000-9