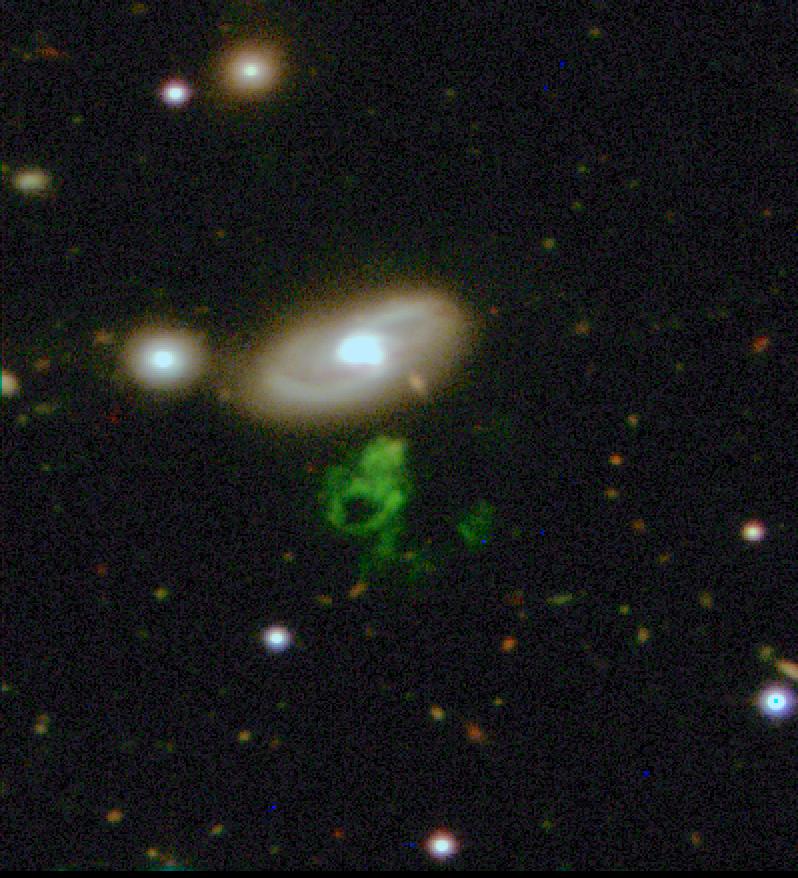
This page is set up to summarize basic data and ongoing study of the curious blue object known as "Hanny's Voorwerp", noted in the galaxyzoo.org public-participation census of the Sloan Digital Sky Survey (original post by Hanny is here). The SDSS gri composite image is shown below, a 101-arcsecond square region; the galaxy to the north is IC 2497.
The object stands out because of peculiar colors, with the g magnitude so bright as to suggest a single very strong emission line. To avoid confusions with the SDSS catalog magnitudes at low signal-to-noise and model dependence from the odd shape interacting with the SDSS photometric procedure, I measure the following (classical, pure-log) magnitudes on the SDSS zero points within a circle including the whole 12x17-arcsecond structure. This also includes the possibly-associated compact source at the cloud's northern tip.
| Band | Integrated magnitude | Point source |
| u | 20.46 | 23.36 ± 0.3 |
| g | 18.29 | 20.48 ± 0.2 |
| r | 22.49 | 21.49 ± 0.1 |
| i | 20.02 | 20.86 ± 0.2 |
| z | >19.0 | 21.83 ± 0.3 |
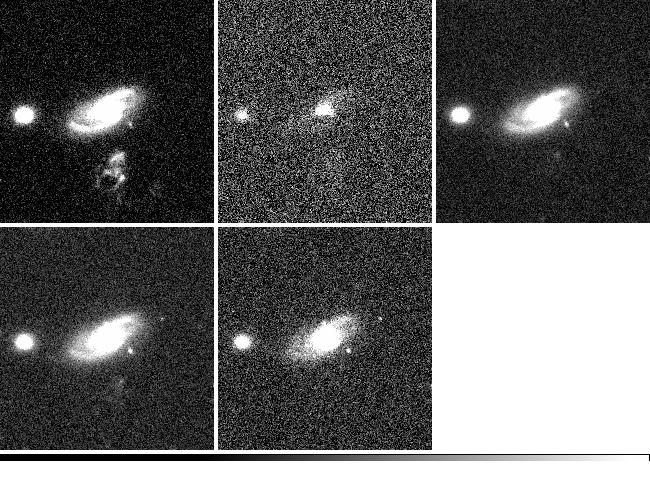
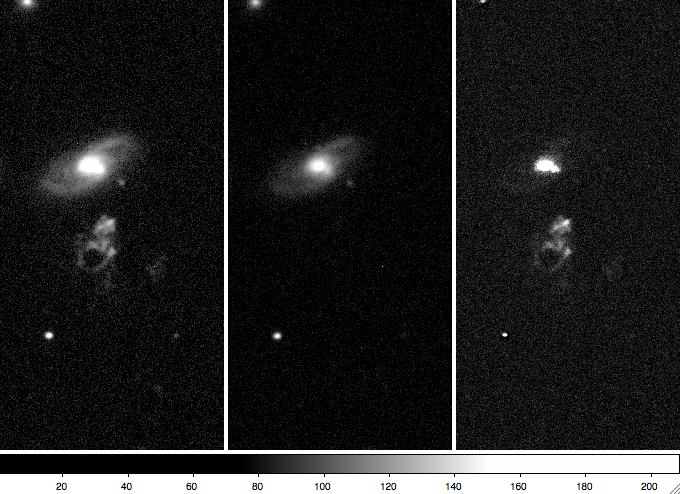
The following montage shows linear intensity displays of the SDSS guriz images at fairly high contrast, rotated to cardinal directions in orientation (north up). Note the intricate filament or shell structure in g.
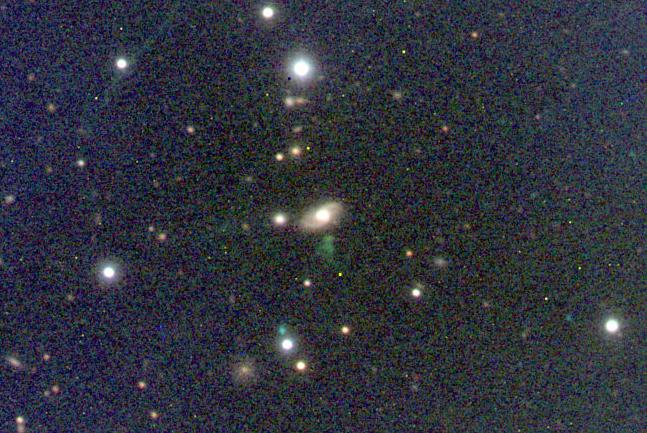
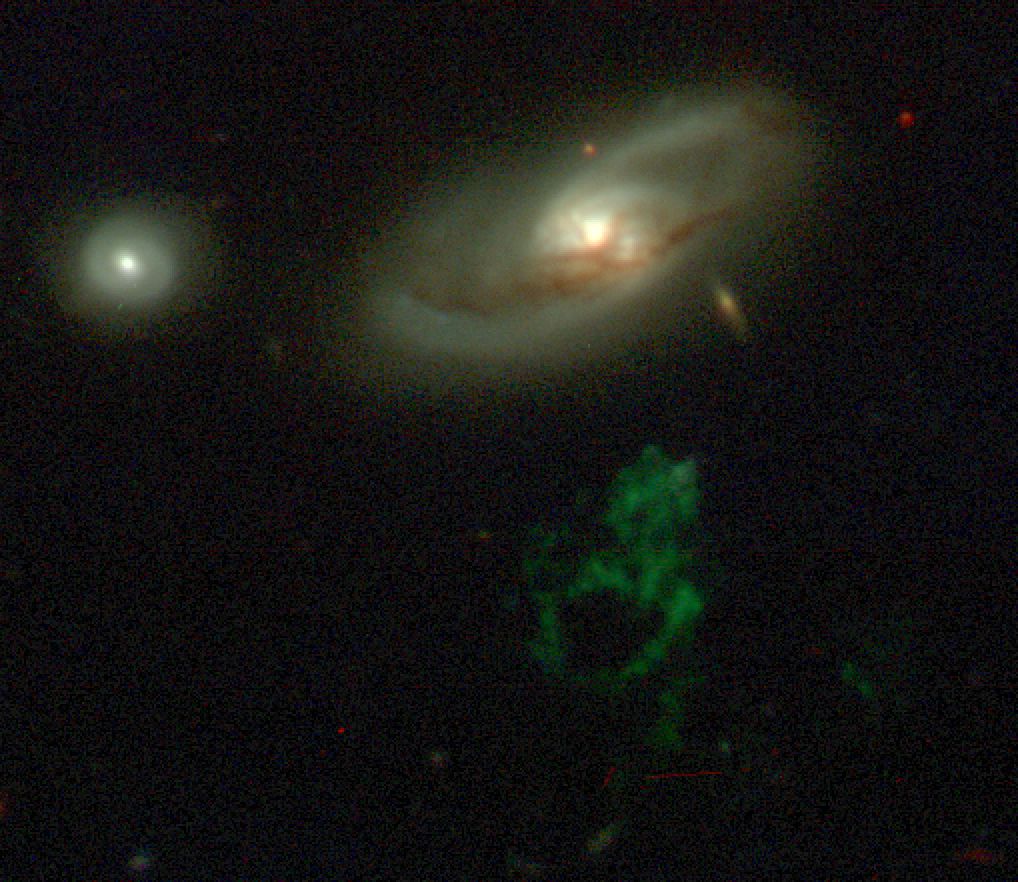
Two rounds of BVR imaging were done in December and January 2008 with the 0.9-m SARA remote telescope. This confirms that much of the emission emerges in a narrow band included in Johnson V; overlapping this with g confined that to the range 5000-5500 Angstroms. The color montage below is from these data and shows a more "true-color" view when pasted together as an RGB image.
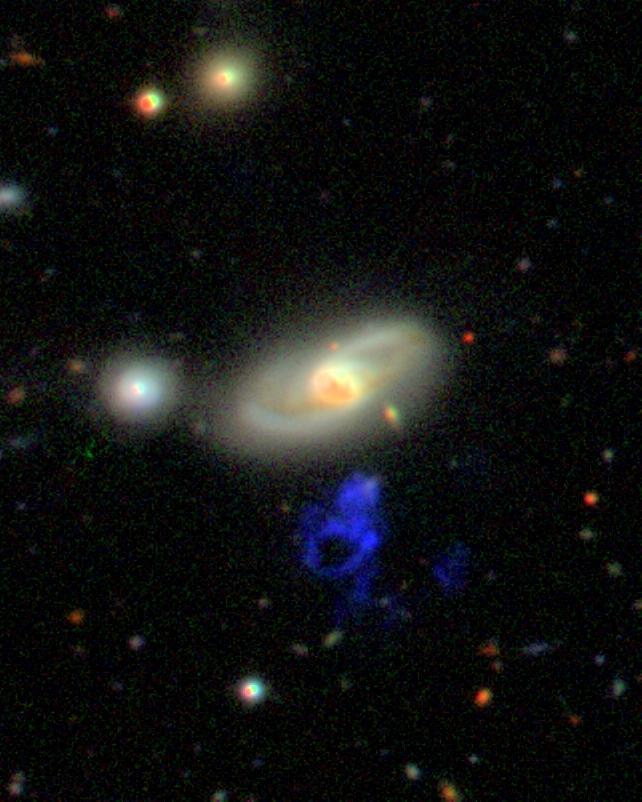
Further improvement came courtesy of Matt Jarvis, who got deeper gri images at the WHT in January 2008, along with an image in He II which fortuitously gets redshifted to almost exactly the wavelength of Hβ in nearby objects, so the camera had a filter that fit. Rotated to about the same orientation, and processed by Kevin Schawinski, here's the WHT image. Not only do we see much more detail in the [O III] emission, mapped to blue, but we see additional clouds of similar emission spread over a much wider area. For scale, the projected distance between the nucleus of IC 2497 and the center of the main blob is about 25 kpc.
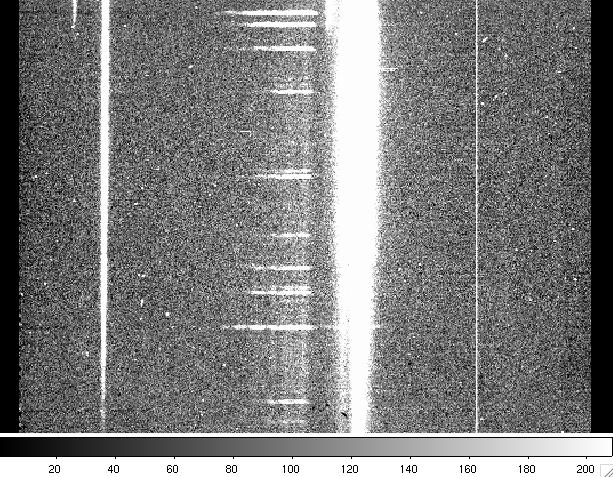
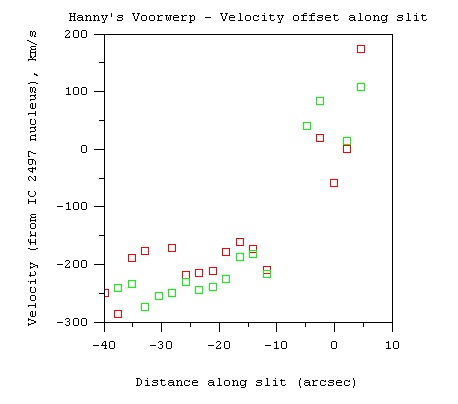
Courtesy of colleagues who were working at the William Herschel Telescope in early January 2008, we have a 2D optical spectrum crossing the cloud and IC 2497. An annotated version of the spectral image is shown below (unlabelled version).
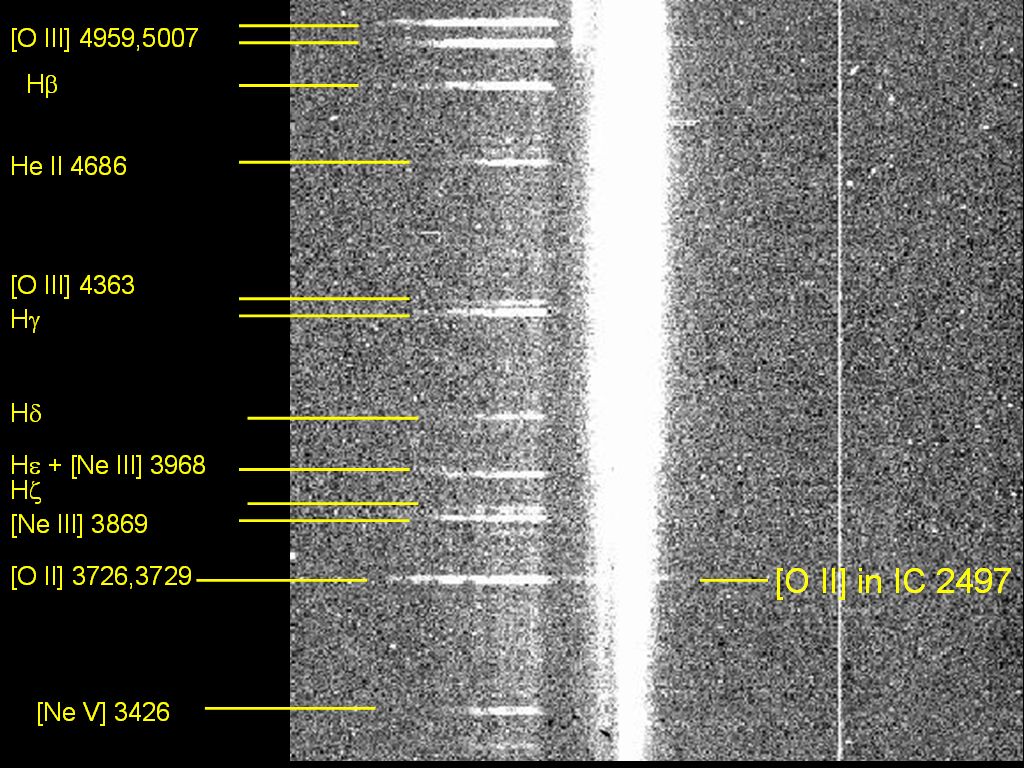
The spectrum shows emission lines typical of star-forming regions spread across the object, at a redshift associating it with IC 2497, but shows, in addition, features indicating unusually high temperature and higher ionization than seen in H II regions. I wrote up this description for the GalaxyZoo blog: First, the gas is hot (even by the standards of ionized nebula). The ratio of [O III] lines between 4363 and 4959+5007 is sensitive to temperature (for those who really want to know why, here is an online lecture including details, with abundant thanks to the late Don Osterbrock for pounding this stuff into my thick head). To have the 4363 line even detectable, the gas has to be unusually hot, more like 15-20,000 K (exact numbers are pending getting the final calibrated spectrum from the observers). Even odder are some of the other lines. He II is produced when an electron joins a bare helium nucleus, and requires high enough temperature or radiation with enough energy to tear both electrons from helium (four times harder than for hydrogen). We don't see this in star-forming regions. The only stars hot enough to produce He II in surrounding nebulae are the central stars of planetary nebulae (which are the hottest stars known, but only for a few thousand years) and a handful of X-ray-bright stars usually associated with accretion onto black holes or neutron stars. On top of that, at the blue end of the spectrum is [Ne V]. If it's hard to rip two electrons from helium, it's that much harder to pull four from neon. This requires 97 electron volts (eV), compared to 54 to make He II and 13.6 to ionize hydrogen. [Ne V] does sometimes show up in planetary nebulae, but even there calculations suggest that it's not the UV starlight that's responsible, but that high-speed shock waves may be the culprit. This line is also common in the spectra of active galaxies - Seyfert nuclei and their kin, where we know that there are abundant X-rays interacting with the gas.
At this point, we know that the object is rich in highly ionized gas. There is continuum light, especially at the northern tip, but the emission lines are so strong that we can as yet say little about its continuum structure. The high ionization might suggest shock ionization or photoionization by an active galactic nuclei, which would have to be much brighter than any we see in the neighborhood. If the AGN is in IC 2497, it must be highly obscured from our direction but not toward the gas. (It may be significant that the cloud lies near the galaxy's projected minor axis). The FIRST survey at 20 cm shows weak emission from the cloud and a significant radio source in IC 2497. We are now pursung further imaging, UV, and X-ray detections to work out what we are seeing here. Whatever it is, it seems to be unique in the SDSS imaging survey. Chris Lintott has queried the database and, after winnowing out imaging artifacts, found no objects with u-g and g-r colors within 0.15 magnitude of what we see in Hanny's Voorwerp.
Speaking of colors - as noted above, this object would be more green if seen with the eye's sensitivity. So, heres a remix of the WHT data to try capturing that hue more closely (click to enlarge):
Our working hypothesis is that Hanny's Voorwerp consists of dust and gas (maybe from a tidally disrupted dwarf galaxy) which is illuminated by a quasar outburst within IC 2497, an outburst which has faded dramatically within the last 100,000 years. More details on why we think so can be found in some entries in the Galaxy Zoo blog: January 18, on the first spectral data; January 31, as we got more images; and March 20, as we started to piece together this whole picture.
Relevant data links:
Back to Bill Keel's home page
Last updated: December 2010