Why study the eye in this context? It was long the detector in astronomy, but was first superceded by photography, then electronic systems. However, it is still much used in acquisition and tracking; on top of that, most of us get more emotional impact if the photons land on our retina than if they're electronically processed onto a screen. More important, the eye/brain system remains THE gateway for our perceptions of data. If you can't perceive something at least in a representation of some kind, you won't know to measure it.
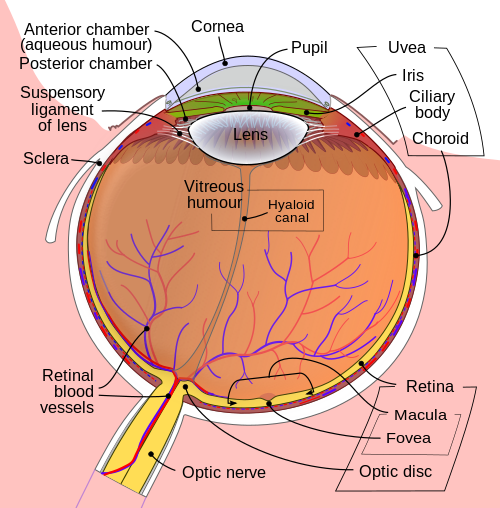
This diagram from Wikimedia outlines the generic features of vertebrate eyes. Light is gathered and focussed by a transparent lens, with focal length varied by muscles stretching the lens or letting it be pulled into a thicker shape so the appropriate rays focus on the retina. The amount of light reaching the retina is modulated by a variable-aperture iris, with a pigmented edge that prevents excess scattered light from intruding. Light scattering within the eye (in the aquaeous humor) is important in limiting the contrast of faint objects - as much as half the light from the dark night sky may be scattered. As an example, objects such as the Andromeda Galaxy are more prominent visually if a tube is used to reduce scattered light.
The eye is a remarkably efficient detector system. As described by Rose and Weimer (1989, Physics Today 42, no. 9, p. 24) the quantum efficiency may be as high as 10%, with spectral response tailored to avoid thermal excitation in the retina. There are four distinct kinds of detection: rod cells that work only at low light levels (with response mediated by photodestruction of the detecting substance) and cone cells, which have three sensitivity passbands, conventionally denoted by the primary colors blue, green (or yellow) and red (though as this article points out, the peak responses are not at those wavelengths). It is noteworthy that out-of-passband response (what in filters would be called red leaks or blue leaks) are important in letting us detect colors that are beyond the peak response of the nominally blue and red receptors. This figure (also from Wikimedia) illustrates these response functions, normalized to the same peak for ease of comparison:

Most people can see stars to magnitude 6 under good conditions, although in laboratory conditions and in a few cases on the real sky a limit close to 8 has been achieved. Somewhere around 30 photons seem to be needed to trigger a response, here again to avoid thermal excitations. By itself, we can use this to estimate a limiting magnitude since (handy rule of thumb from Joe Wampler) a star at V=0 gives 1000 photons per cm2 per Angstrom. The fully dilated pupil has an area of about 0.5 cm2, and for a passband 2000 A wide, this implies that about 106 photons reach the eye per second from such a star, or for a temporal sampling of about 1/30 second, close to 30,000 photons. To have 30 detected photons in the same time interval would need a star at V=7.6, not too far from the laboratory results.
Study of the eye as a detector is inseparable from the brain's signal processing, which employs binocular fusion and memory, via sweeping the field of vision to cover a large area with the small part of the retina (fovea) that has densely packed cones and so high angular resolution. The eye is considered to have a resolution element of order 1 arcminute, and resolution near 3. Some people can just make out the crescent of Venus (1 arcmin diameter near inferior conjunction) or note that Jupiter appears just slightly larger than Sirius, and most can separate 3-arcminute double stars with a bit of trouble. The diffraction limit of a lens with the diameter of a fully dilated pupil is of order 25 arcseconds, so the resolution is set by the packing of retinal cells and aberrations in the eye's lens. (Most people actually see stars as points surrounded by highly structured halos).
There are many special features of the eye's response at low levels, and thus of special interest in astronomy:
These must be taken into account in, for example, visual observation of variable stars. Furthermore, we would like to know the response of the eye/brain to intensity differences. This is often stated to be logarithmic, but there is recent evidence that a different form reproduces the observations somewhat better. This knowledge makes a difference in how one interpolates visual intensity estimates - are they linear differences in the log, or what? We still often use a magnitude system which is said to go all the way back to Hipparchus' star catalog, with more exact definitions as techniques warranted.
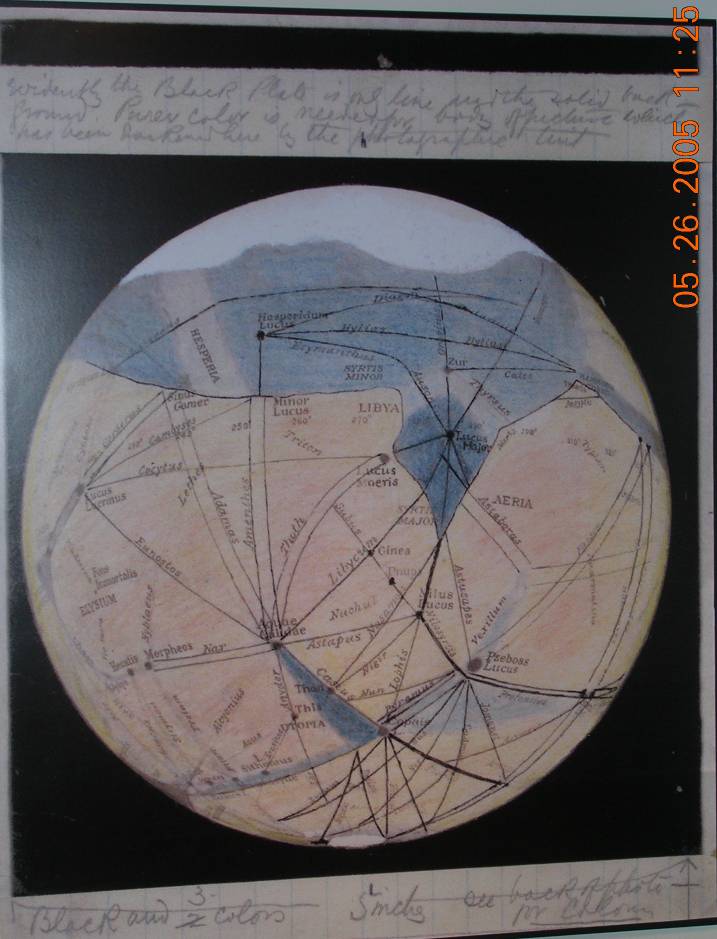
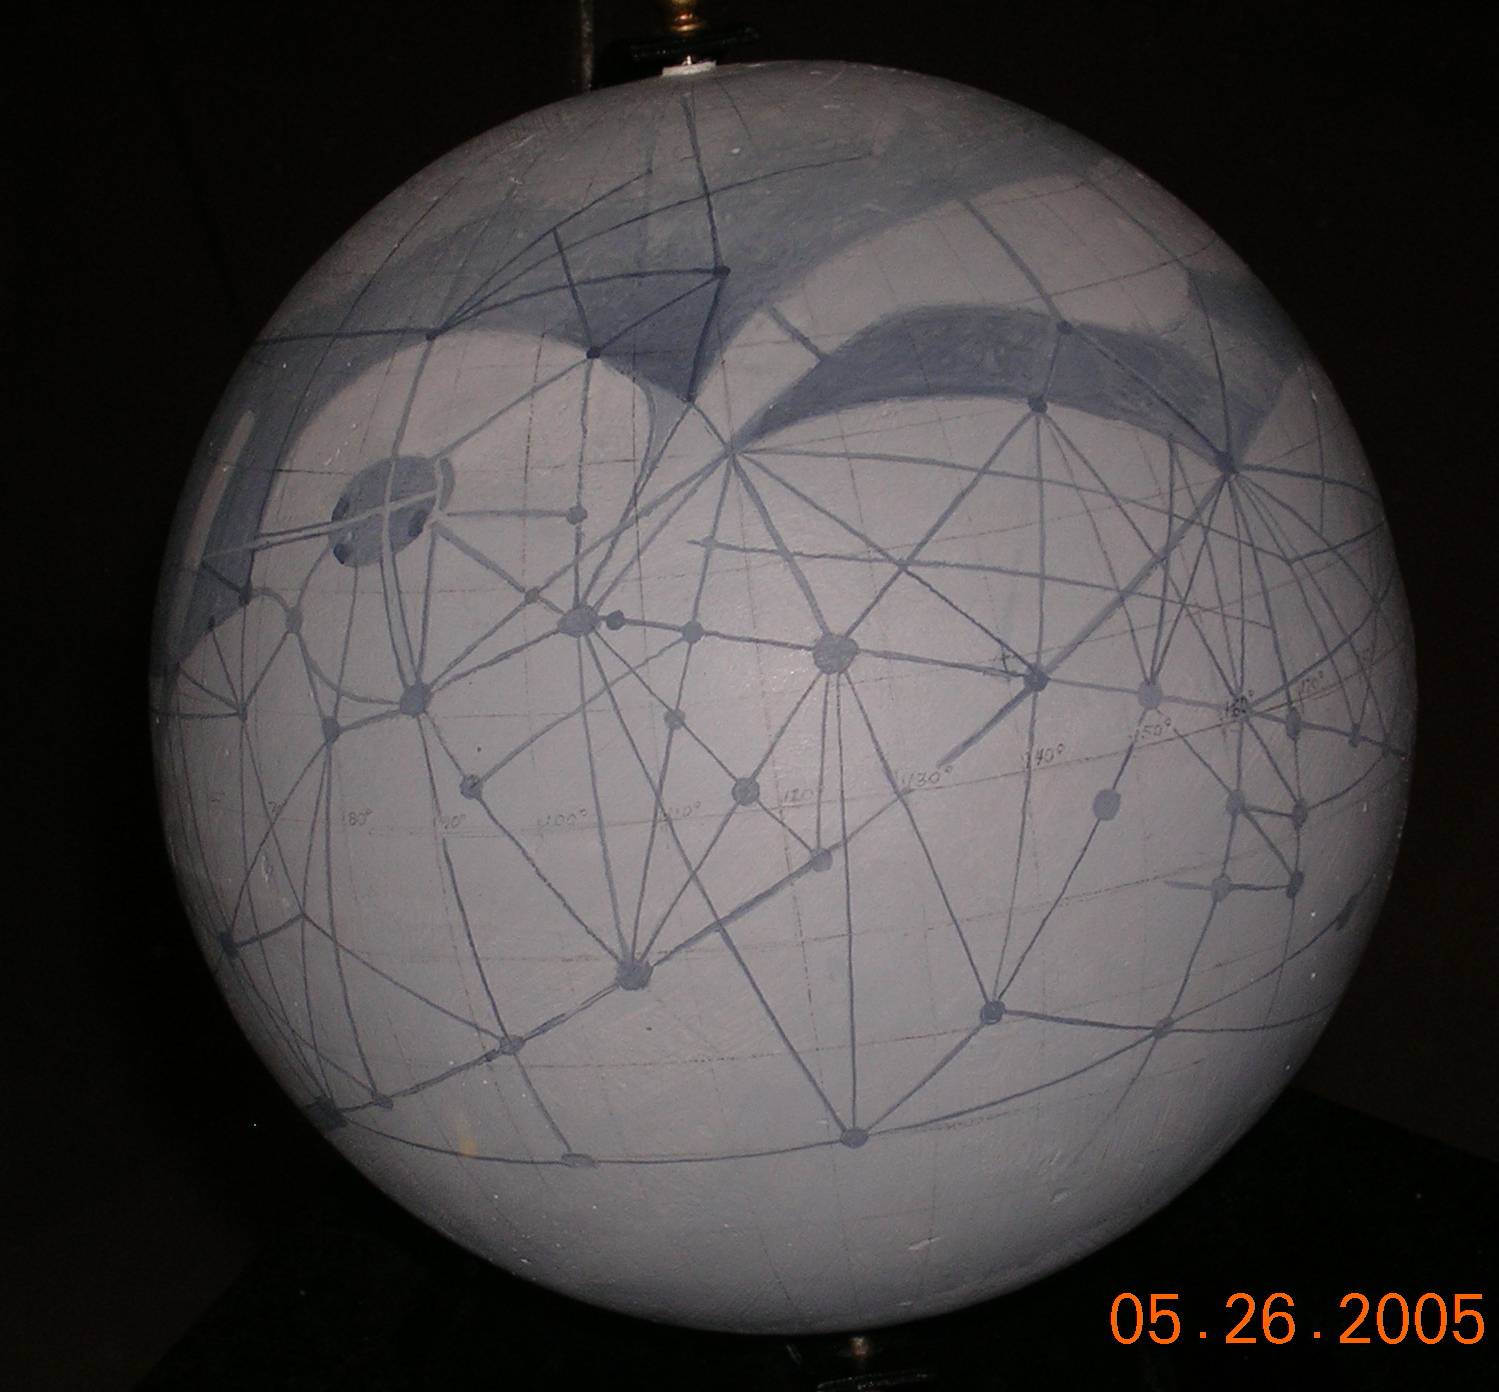
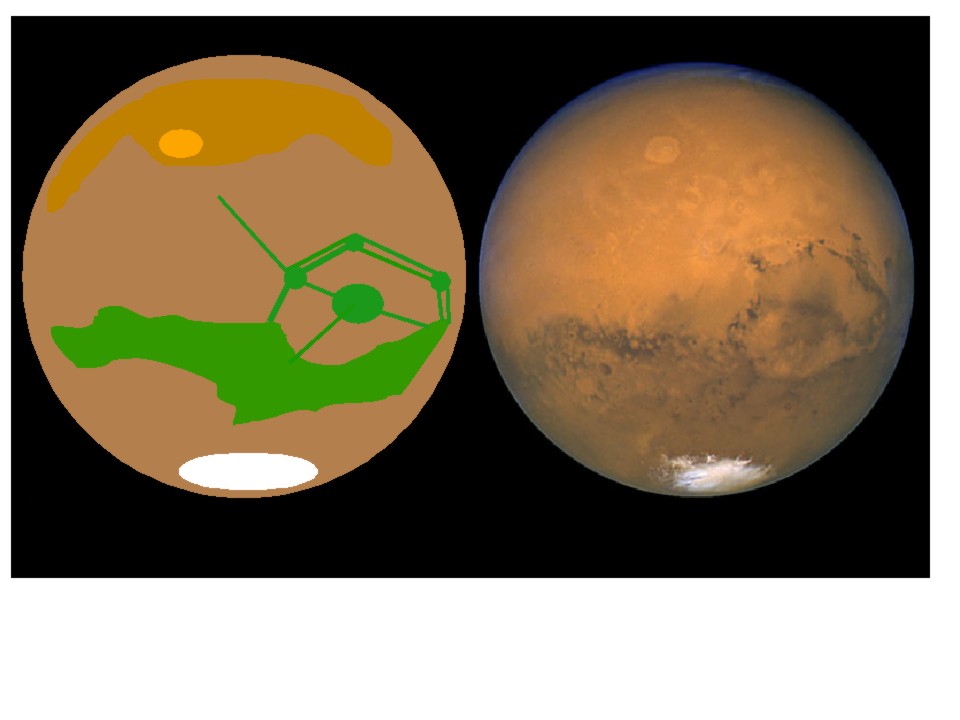
Further complications arise the more processing the brain does. A prime example is the Moon illusion; our systems are not really wired to deliver raw angular scales. Most notorious is the tendency of our perception to look for patterns; this is often useful but has the scientifically questionable outcome of making it very easy to see familiar patterns in complex visual environments. The prime example of this was, of course, the Martian canals. Many astronomers in the late 19th and early 20th centuries drew more or less regular networks of linear dark lines on the Martian surface, sometimes in parallel pairs. Percival Lowell is best remembered, thanks to his eloquent books popularizing the notion of a dying Martian civilization extrapolated from these drawings. Here is one of his drawings, and a composite globe from his observations. The perception issues may be clarified by examining a side-by-side image such as this, preferably through a narrow tube which excludes any color reference to other objects in the visual field. One is Mars as seen by HST, the other the same piece of Mars sort of as Lowell drew it (but less elaborate).
One might also recall faces in nebulae (an example of pareidolia), or reports of changes in lunar craters (such as Linne') which just happened to stop when visual observations were supplanted by photography.
Last changes: 1/2013 © 2000-2013